How bad has your winter been?
Statistics may clash with impressions
Feb 7, 2013 - by Staff
Temporary impacts to NSF NCAR Road, Parking Lot and Trails
View more information.Feb 7, 2013 - by Staff
Bob Henson • February 7, 2013 | A colleague who grew up in Chicago recently mentioned that her friends back home were complaining about how cold it’s been. Certainly, the Windy City has had a few bracing days in the last few weeks, and a potentially historic snowstorm is on tap for parts of New York and New England this weekend.

Chicago is prone to rough winters, as depicted in this scene from January 12, 2012. (Flickr image by Justinilla Escamilla.)
But how do you determine whether a given location, or the nation, is having a truly brutal winter?
As it turns out, the story differs depending on whether it’s being told through events, statistics, or opinions. (See April 4 update at the end of this post.)
Our impressions can be strongly colored by a key experience or two. A stellar couple of days on the beach can push unpleasant memories of travel hassles into the background. A spectacular finale might salvage an otherwise mediocre film. So it’s possible that people can interpret a “bad” winter as being the one with a handful of bitterly cold or snowy days, even if the other 90 or so days aren’t really that bad.
Let’s see what the numbers tell us about the current U.S. winter.
NOAA’s National Climatic Data Center hasn’t yet released summary data for January. But the previous month was the nation’s 10th warmest December in 118 years of recordkeeping, with all 48 contiguous states running above average. So using the official definition of meteorological winter (December–February), the first third of this one doesn’t stand out as especially fierce.
Update • February 15
The first month of 2013 was the nation's 39th warmest January on record, according to NOAA/NCDC. The Dec–Jan. period ranked as the 18th warmest on record. The first two weeks of February saw about twice as many daily record highs (180) as record lows (91) set or tied.
January brought a wild parade of weather across much of the central and eastern United States, while much of the West was mired in a frigid, dank air mass (or air mess, if you prefer). The persistent inversion led to one of the worst multi-week cold spells on record in parts of Utah and Colorado. For the month as a whole:
Some parts of the West that are less prone to inversions got the same early-January cold blast but managed to clear out and warm up more quickly, so that their month ended up only a bit below normal. Phoenix had its 44th coolest January, for example.
Meanwhile, the roller coaster of cool-downs and warm-ups brought the Midwest and East plenty of weather variety, including temperatures below 10°F in many spots. Still, the month as a whole ended up milder than the typical January practically everywhere, from Minneapolis (16.9°F, or 1.3° above average) to Chicago (26.6°F, or 2.8°F above average) to Washington (40.3°F, or 4.3°F above average) and New York (35.1°F, or 2.5°F above average).
Further south, Floridians basked in one of the balmiest Januarys ever observed there (see PDF). Miami tied for its fourth warmest January on record (73.2°F, or 5.0° above average), with a string of 15 days in a row reaching 80°F or higher.
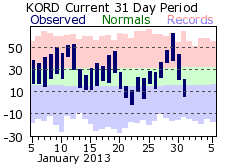
Temperatures have gone through some wild swings in Chicago over the past month, but both December and January were above average as a whole. In this 30-day graph, days of the month appear along the bottom axis. Temperature readings (left axis) are shown in degrees F. The dark blue bars indicate each day’s high and low compared to the average daily range (green) and the records for each date (top of the salmon bars and bottom of the purple bars). (Image courtesy National Weather Service, Chicago.)
As for Chicago, a rare midwinter influx of mild, humid air on January 29 brought the city up to 63°F, just four degrees short of its all-time January high. Temperatures did manage to hang below 20°F for two days, even dipping to –1°F on the 22nd. But that doesn’t hold a candle to such epic cold blasts as the one in January 1985, when the city notched its all-time low of –27°F. And temperatures for the month as a whole ended up well above average.
I reported to my friend from Chicago that her hometown was actually having one of its warmer winters on record. Her reply: “I guess Chicagoans have just become too comfortable with mild winters!” Indeed, in a warming climate, a particular benchmark of cold might feel colder than it used to.
Last year we posted an in-depth report on the connections, or lack thereof, between weather events and increased greenhouse gases that includes a two-minute animated video about “Steroids, Baseball, and Climate Change.” The video illustrates how, just as a baseball player taking steroids might achieve a higher batting average but still strike out at times, a climate warmed by fossil fuel emissions can produce more record highs even as record lows are still possible.
Since we released that video, the lopsided U.S. ratio of record highs to lows now tilts even more dramatically toward the warm side. For the last year (February 7, 2012, to February 5, 2013), here’s the tally from the U.S. Records page at NOAA’s National Climatic Data Center:
Daily record highs: 32,946
Daily record lows: 6,614
That ratio of nearly 5:1 has steadily climbed from a value of 2:1 last decade and even lower ratios in preceding decades.
Even with the sharp bouts of cold in many parts of the nation, the past 30 days saw 10 times as many daily record highs (2,386) as daily record lows (295) set or tied.
The numbers are even more dramatic when looking at all-time highs and lows (the warmest and coldest readings ever measured at a given station).
Number of U.S. stations that matched their all-time lows in the last year: 7
Number that broke all-time lows: 0
Number that set or broke all-time highs: 356
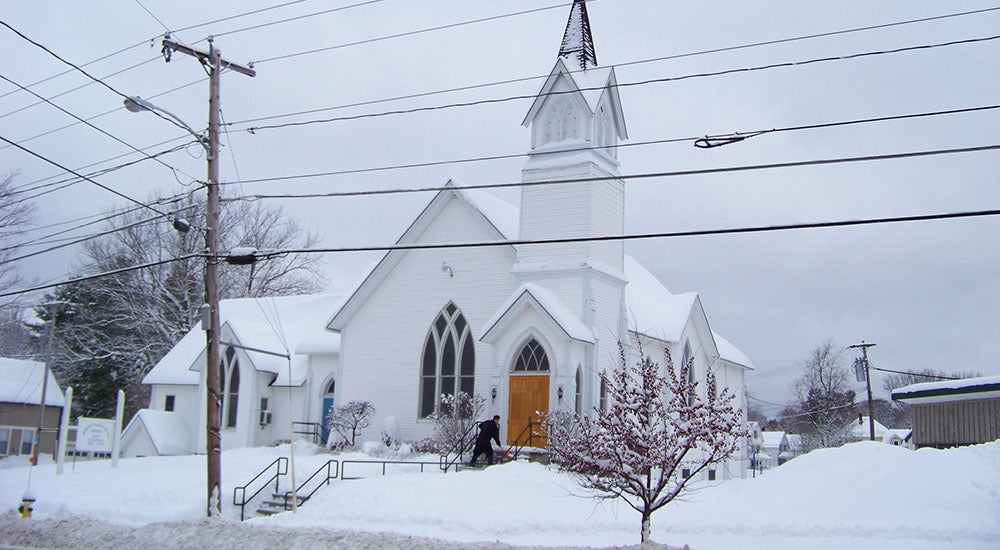
The snowstorm of early February 2013 could rank as a standout in New England weather annals. This photo was taken on January 20, 2010, in Lisbon Falls, Maine. (Creative Commons image from Flickr by samm4mrox.)
If all this talk of a warming climate has you wanting to find out more, we’ve just completed the annual update of our FAQ on global warming and climate change. It’s a handy source of brief explanations and relevant context, including one Q&A that’s quite timely as a mammoth snowstorm bears down on New England and the Northeast:
“It's been really cold, with lots of snow. So what happened to global warming?”
Update • April 4
It wasn't such a cold winter after all.
The three months from December 2012 to February 2013 ended up as the 19th warmest in the last 118 years of weather records for the contiguous 48 states, according to NOAA's National Climatic Data Center. The state-by-state breakdown (see map below, where numbers correspond to rank relative to the 118-year record) shows a deeply divided nation, with a very mild three-month average east of the Rockies and notably cold conditions from Colorado southward and westward.
March isn't technically part of meteorological winter, but the unusually chilly conditions this past March (statistics not yet available) could influence people's memories of the entire season.
It was also an unusually moist winter east of the Rockies, with several states in the Midwest and Deep South having a top-10 wettest winter.
