Long-range tornado prediction: Is it feasible?
Researchers scope out new forecast territory
Jul 29, 2013 - by Staff
Temporary impacts to NSF NCAR Road, Parking Lot and Trails
View more information.Jul 29, 2013 - by Staff
Bob Henson • July 30, 2013 | Just as forecasters now peg the odds of a busy Atlantic hurricane season months in advance, we might soon have outlooks that assess the risk of an active tornado season weeks or even months ahead of time.
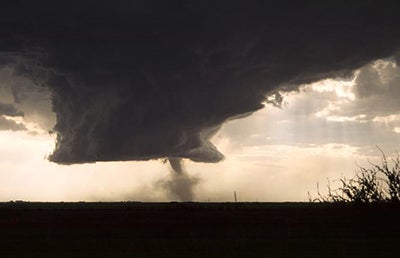
More than 1,000 tornadoes strike the United States in a typical year—sometimes in clusters of more than 50 in a single day. (©UCAR. Photo by Greg Thompson. This image is freely available for media & nonprofit use.)
Such a system isn’t yet on the drawing board, but researchers are exploring how it might work. A white paper prepared earlier this year by a team of NOAA and university scientists is now making the rounds, and a testbed could be in place as soon as the spring of 2014.
“We’d like to move toward something probabilistic, much like the hurricane outlooks,” says NOAA’s Scott Weaver. He’s the lead author of the white paper, which includes the testbed idea as well as a variety of other recommendations.
The white paper emerged from workshops in May 2012 and March 2013 (see writeup and video clips here) that included tornado specialists, climate scientists, and representatives from the insurance industry.
“We’re interested in learning the best ways to make this useful to decision makers,” says Weaver.
The push to explore extended (two- to six-week) and seasonal (three-month) tornado prediction has gained momentum due to several factors.
Currently, NOAA’s Storm Prediction Center (SPC) issues convective outlooks that highlight parts of the country that can expect tornadoes and other severe weather up to eight days in advance. There’s no system in place for predictions going beyond that eight-day window.
In contrast, hurricane outlooks that extend as far as a year ahead are issued for the North Atlantic and Northwest Pacific several times each year by Colorado State University, NOAA’s Climate Prediction Center, the private firm Tropical Storm Risk, and other groups (see this PDF summary of 2013 outlooks from Risk Management Solutions). Forecast skill is generally modest, especially for major hurricanes and for the longest-range periods, but the outlooks are followed closely and given wide coverage in the media.
It’s important to note that while these outlooks sometimes indicate which parts of the U.S. coast are most vulnerable to a landfalling tropical cyclone in a given year (e.g., the Gulf of Mexico or the mid-Atlantic), they make no effort to predict individual hurricanes.
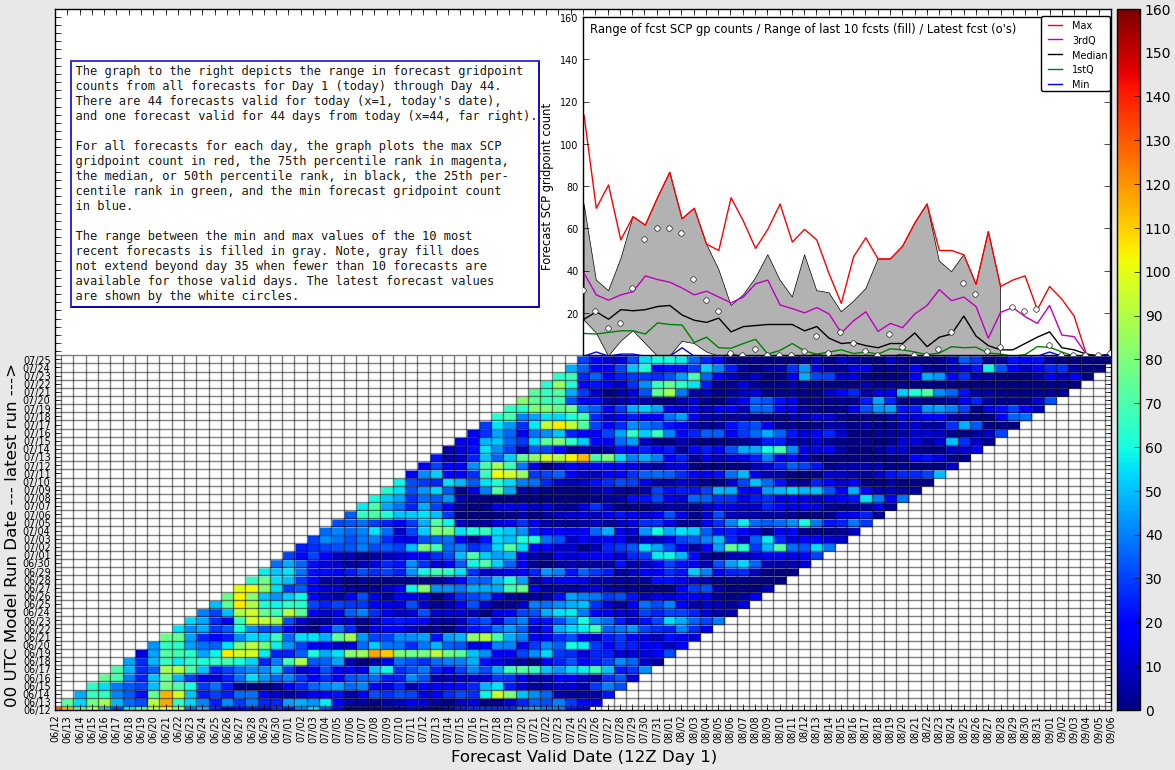
This experimental tool is one of the newest ways of monitoring and assessing long-range predictions of severe weather. It’s informally referred to as a “chiclet chart,” based on its resemblance to the trademarked chewing gum. Each colored box shows the anticipated likelihood of severe weather, with warm colors indicating a higher risk, as indicated by daily runs of the NOAA Climate Forecast System that each span a 44-day period. The vertical axis shows the day each run was carried out, with that run’s results extending from left to right. The horizontal axis shows the date at which a given forecast is valid. Thus, the bright orange box at lower right is the result valid on July 8 from the CFS run of June 19. Each row depicts a single run’s results, while each column shows run-to-run consistency. The enhanced risk of some severe weather episodes, such as those that occurred on June 21 across the Upper Midwest and June 28 across the Southeast, is evident up to a week or more in advance. Click on image for a fuller view. (Image courtesy Greg Carbin, NOAA/SPC, and Michael Tippett, IRI.)
Along these lines, it’s possible that a long-range tornado outlook might specify the odds of enhanced severe weather weeks to months in advance across broad regions of the country (e.g., the upper Midwest, Southeast, or southern Great Plains) without trying to forecast when or where a specific tornado outbreak might strike.
What might such a forecast actually look like? Greg Carbin (SPC) and Michael Tippett (International Research Institute for Climate and Society) are experimenting with techniques for converting climate-model output into monthly tornado probabilities and presenting those odds graphically.
Are today’s models up to the task of long-range tornado outlooks? There are indications that climate models such as the CFS can sometimes detect the large-scale circulation trends conducive to severe weather weeks or even months out. Researchers are now working to quantify just how skillful these projections are.
The trick is that even when large-scale patterns are favorable, tornadic storms don’t always materialize. Local and regional subtleties often get in the way, such as the formation of clouds that reduce instability or the emergence of “capping” layers of very warm air a mile or two above ground. These factors can be challenging to pin down even a day or two in advance. Still, knowing that storm-friendly large-scale patterns are more likely might provide at least some measure of value to emergency managers, utilities, insurance companies, and others hungry for any morsel of guidance.
Not all experts are convinced of the value of seasonal tornado outlooks, including NCAR’s Morris Weisman. He was one of the coordinators of a thunderstorm-related field project this spring called MPEX (the Mesoscale Predictability Experiment), which examined how to make 6- to 24-hour forecasts of severe storms more precise in time and space. The project’s 18 days of field operations included the two disastrous events in central Oklahoma on May 20 and May 31.
MPEX data suggest that expanded observations could add skill in some cases to severe weather prediction within the one-day window, says Weisman. As for the notion of longer-range outlooks, he wonders how useful these can be, given the huge importance of the short-range factors noted above.
“So many times I’ve seen big events be completely misforecast beyond five days,” says Weisman. “The details change dramatically.”
Even though seasonal forecasts wouldn’t be aimed at predicting specific severe weather episodes, Weisman believes the signals embedded in El Niño and other climate shapers are still too weak for seasonal forecasts to provide a great deal of value. “The methodology being proposed is fine,” he says, “but the assumption is that we do have some level of skill at those time scales, and I submit we don’t—yet.”
Purdue’s Jeff Trapp, who was also a PI on MPEX, agrees up to a point. “Although we and others have basic methodologies that can be applied to this problem, we still need to demonstrate that the predictions can be skillful,” says Trapp. “Such a demonstration needs to happen before we can begin to talk about a timeline for implementation.”
Still, he adds, “I do think it will be plausible to identify, with relatively long lead time, regions where relevant environmental conditions will be anomalously—and persistently—large. The outstanding question is whether that potential lead time is two weeks, or four weeks, or twelve weeks.”

This year’s U.S. tornado tally (black line) is lagging well behind its counterparts from the last nine years. Click on image for full version. (Image courtesy NOAA Storm Prediction Center.)
Has 2013 been a bad year for tornadoes? The answer depends on your perspective. Late May brought a multi-day barrage of violent storms to central Oklahoma, with tornadoes on May 19, 20, and 31 that killed at least 33 people. The EF5 twister that struck Moore, Oklahoma, on May 20 destroyed or damaged thousands of structures and delivered an estimated $2 billion in damage, making it one of the costliest tornadoes in U.S. history.
Yet outside of those few devastating days, it’s been an unusually tranquil year for U.S. tornadoes. As of July 21, the “inflation adjusted” tally of U.S. tornadoes for 2013 was 564, which puts it near the lowest values for any year since records began in 1950. Weak tornadoes are spotted much more frequently now than in past decades, so NOAA’s inflation-adjustment analysis removes this linear upward trend (see details here). This allows for an apples-to-apples comparison from the 1950s into the 2010s.
Even when looking at raw tornado counts for the last nine years to date, this year (664 tornadoes as of July 21) falls well below 2005, its nearest competitor (817 tornadoes as of July 21). And 2013 is running far behind 2008, which had notched 1773 twisters by this point.
For seasonal prediction, it turns out that the number of days with tornadoes in a given year may be easier to predict than the total number of tornadoes. However, researchers are well aware that a “quiet” season, with few tornado days, can still include a few catastrophic events, so they’re pondering ways to address the issue. It’s not unlike the phenomenon of a relatively placid hurricane season that produces a single monster storm. That was the case in 1992: the year’s only U.S. landfalling hurricane was Andrew—one of the most destructive on record.
An innovative model could help serve as a bridge between large-scale seasonal forecasts and potential tornado outlooks. The Model for Prediction Across Scales (MPAS), whose development is based at Los Alamos National Laboratory and NCAR, includes atmosphere and ocean components. MPAS was made available to the research community at large in June.
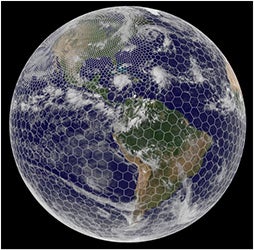
The innovative MPAS design includes hexagonal grid cells that allow for tighter meshes in areas of interest (evident here in the United States). The mesh also avoids the convergence of latitude and longitude bands in polar regions that occurs in traditional models. (Image courtesy MPAS.)
MPAS is one of the first weather and climate models that tiles the globe not with latitude-longitude boxes but using a Voronoi mesh—a honeycomb-like array of hexagons whose resolution can be tightened in areas of keen interest (see image at right). MPAS include moisture-related processes and dynamics that allow it to explicitly simulate convection (showers and thunderstorms) at higher resolutions while capturing circulation patterns across the globe at the same time. Current tests are being performed using a mesh spacing of 3 kilometers (1.9 miles).
MPAS was tested last fall in one of 11 Accelerated Scientific Discovery projects that got the first allocation of time on NCAR’s new Yellowstone supercomputer. The map below is drawn from a replication of a storm in October 2010 that produced the lowest surface pressure ever observed in North America. The model successfully produced isolated severe thunderstorms akin to those actually observed ahead of a cold front in the Tennessee Valley.
“There are tropical cyclones and other interesting features elsewhere that are well simulated, but isolated convection is the critical feature we’ve been examining in some detail,” says NCAR’s Bill Skamarock, one of the lead MPAS developers.
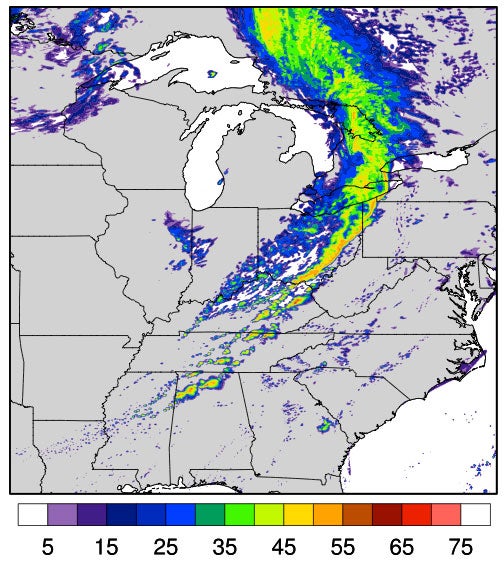
The high resolution and flexible grid structure of MPAS enable it to produce realistic patterns of showers and thunderstorms. In one recent experiment conducted on NCAR’s Yellowstone supercomputer, MPAS issued a six-day forecast starting with actual data from 00Z on October 23, 2010. The map above shows simulated reflectivity for a three-hour period ending at 00Z on October 27. The 3-km resolution allows for some of the structure of supercells to be reproduced in storms across Alabama, Tennessee, and Kentucky, where several tornadoes were observed. (MPAS image courtesy Bill Skamarock, Michael Duda, Laura Fowler, Joe Klemp, and Sang-Hun Park.)