El Niño or La Nada?
The great forecast challenge of 2014
Mar 18, 2014 - by Staff
Mar 18, 2014 - by Staff
March 18, 2014 | Seasonal forecasting can’t tell us with certainty whether to expect hotter-than usual or milder-than-usual weather this summer. Yet we might soon have a stronger sense of what late 2014 and early 2015 are likely to bring to large parts of the globe.
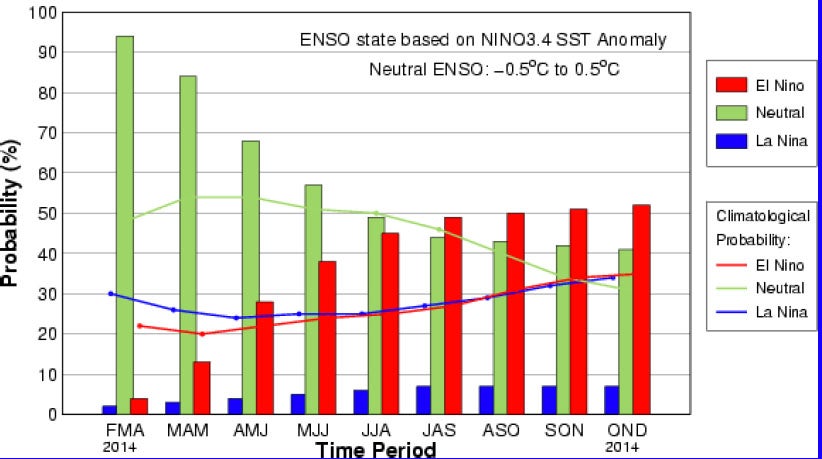
Forecasters at NOAA's Climate Prediction Center and the International Research Institute for Climate and Society released this ENSO forecast on March 6. It will be updated in early April. The outlooks indicate only the probability of El Niño, not how strong it might be. (Image courtesy CPC/IRI.)
That far-sighted confidence will hinge on whether or not a major El Niño event develops in the Pacific Ocean. On March 6, NOAA’s Climate Prediction Center issued an El Niño watch, meaning that it places the odds of El Niño by autumn at just over 50 percent. Neutral (“La Nada”) conditions were deemed almost as likely, with much less chance of La Niña. (See graphic.) CPC issues an update of unfolding conditions each Monday and a more thorough evaluation about once a month (both available here).
For many years, NOAA has issued seasonal U.S. outlooks that extend out as far as 12 months. The skill of these long-range outlooks varies—it declines the further out you go, and it’s higher at some times of the year than at others—but the single biggest variable is El Niño and its sister event, La Niña, which are together referred to as the El Niño/Southern Oscillation (ENSO). As researchers work to make seasonal forecasts more reliable and useful to society, they want to better anticipate when El Niño or La Niña will occur and how strong it will be, as well as map out its impacts in greater detail.
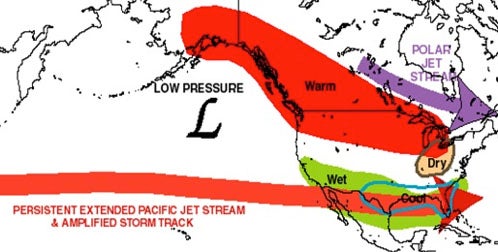
This map shows the most common anomalies in the January-to-March period while a moderate or strong El Niño is in progress. These patterns are less likely to hold during a weak El Niño. (Image courtesy NOAA/National Weather Service.)
Years of research have shown that the hallmark of a strong El Niño event—warming of the sea surface by 1.5°C (2.7°F) or more across the eastern tropical Pacific—shifts the location of equatorial showers and thunderstorms eastward by thousands of miles. That shift creates atmospheric reverberations that alter circulation and rainfall across even more far-flung regions.
In the United States, a strong El Niño event tends to mute north-south temperature contrasts, so that it’s typically milder than average to the north and cooler than average to the south. It can also sharpen north-south precipitation divides, making it drier than usual in the Midwest and wetter than usual across the Sunbelt.
For a weak El Niño event, these effects aren’t simply weaker—they’re also less consistent and reliable. This means that seasonal predictions based on a weak El Niño are more likely to go awry. In California, for instance, a strong El Niño event very often brings more moisture than usual. However, San Francisco and Los Angeles are a bit more likely to be unusually dry than unusually wet when El Niño is weak.
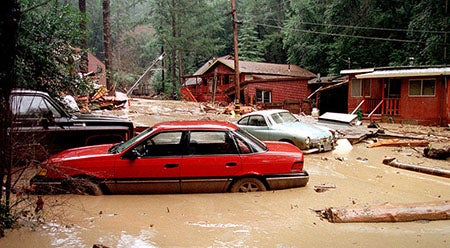
Mudslides struck northern California in March 1998, toward the tail end of the intense 1997–98 El Niño. Although strong El Niño events typically bring heavy rain to California, the state can also experience severe flooding during non–El Niño years. (Photo by Dave Gatley, FEMA)
Most of the El Niño events over the last 15 years have been on the weaker side. However, some conditions in the western tropical Pacific are now strikingly similar to those that preceded the two strongest El Niño events of the last century: 1982–83 and 1997–98.
If El Niño doesn’t take shape in the next several months, we may not see it this year at all. “Once you get toward summer, the odds of getting a major El Niño certainly start to go down,” says NCAR scientist Kevin Trenberth.
Should a truly significant El Niño event develop by June or July, it would give us months of advance notice about which parts of the United States are likely to be cooler, milder, wetter, or drier than average come next winter. You still wouldn’t have a specific forecast for New Year’s Day or Groundhog Day in your hometown, but even a slight shift in seasonal odds—as long as it’s a confident shift—could mean millions of dollars for utilities, agricultural firms, insurance companies, and others in a position to hedge big bets.
If you’d like a refresher course on exactly what El Niño and La Niña are, see “A mini-primer on ENSO,” below.
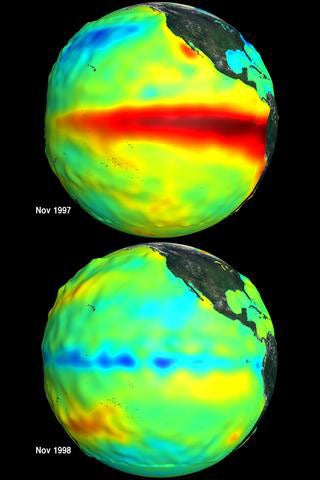
Sea surface temperature and height anomalies in the eastern Pacific Ocean show the influence of expansion and warming during El Niño (November 1997, top) and cooling during La Niña (November 1998, bottom). (Images courtesy NASA.)
In some ways, a major El Niño event would be a welcome break for seasonal forecasters. They’ve had a tough row to hoe over the last few years.
Aside from occasional visits by La Niña, the relatively weak El Niño events and frequent neutral periods since 2000 have allowed other, less-predictable influences, such as the North Atlantic Oscillation, to dominate. In turn, that’s led to some high-profile busts in seasonal forecasts—including this winter, which few thought would be as cold as it turned out to be in the Midwest and Northeast, as well as the Atlantic hurricane season of 2013, which was far less active than expected.
A 2012 analysis in the Bulletin of the American Meteorological Society brings this issue into focus. It evaluates ENSO forecasts from 20 different prediction models for the period 2002 to 2011. The skill of these models actually declined in the 2000s as compared to the 1980s and 1990s. This isn’t due to a loss of model sophistication (that’s actually improved), but rather because the weaker, more variable ENSO events left the models with less to go on.
“After adjusting for the varying difficulty level, the skills of 2002–11 are slightly higher than those of earlier decades,” notes the study, which was led by Anthony Barnston (International Research Institute for Climate and Society, or IRI).
Experts agree that seasonal prediction still has a long way to go before it’s relied on in the same way as day-to-day weather forecasts.
“The models are far from perfect,” says Stephen Zebiak, director of the Climate Services Partnership Secretariat at IRI and a pioneer creator of ENSO forecast models. “They have a number of systematic errors that we haven’t made much progress on in the last 20 years.”
As a potential El Niño event approaches the eastern tropical Pacific, our view is partially obscured by the failure of many buoys that sample this region below the sea surface.
Several dozen buoys were deployed in the 1980s and early 1990s following the nearly-undetected arrival of the major 1982–83 El Niño event. They played a central role in detecting the 1997–98 El Niño event months before its impact on the United States. This array is now part of a international, Pacific-straddling network called the Tropical Ocean Atmosphere/Triangle Trans-Ocean Buoy Network (TAO/TRITON).
Over the last few years, vandalism and normal wear and tear have taken their toll on buoys maintained by the United States. Tight budgets have made it difficult for NOAA to carry out needed buoy maintenance in the eastern Pacific, a region critical for determining if El Niño is actually taking shape. Other data sources, such as drifting buoys, are filling in some but not all of the gaps. A January editorial in the journal Nature painted the problem in stark terms and called for international cooperation to address it.
“The good news is that our 2014 budget offers relief,” says National Weather Service spokesperson Susan Buchanan. “The first maintenance cruise will be underway within the next two weeks. We are hopeful that we will be able to restore the TAO array to near 80 percent by the end of this year.”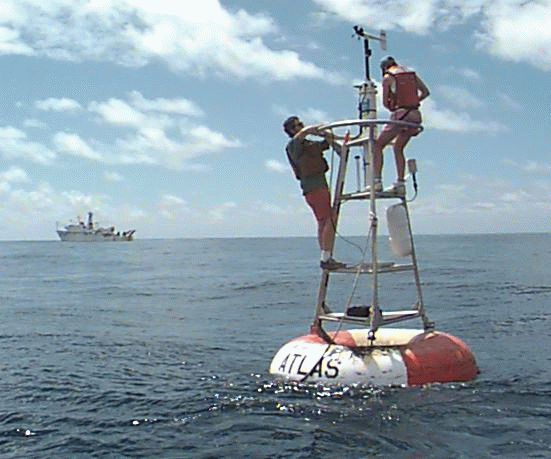
Dozens of instrumented buoys were moored throughout the equatorial Pacific Ocean in the early 1990s, as part of what’s now called the TAO/TRITON array. The array gathers surface meteorological and oceanographic data and records ocean temperature to a depth of about 1,650 feet. (Image courtesy NOAA.)
For example, many models still have difficulty reproducing the complex undersea structure of the tropical Pacific and its evolution during El Niño. Zebiak’s own landmark ENSO prediction model (developed with colleague Mark Cane) has had its share of hits and misses after initial success in the late 1980s.
One roadblock to progress is that only a few El Niño and La Niña periods have been thoroughly documented by satellites and buoys put in place since the 1980s, so there are only a handful of events to test models against—and only a couple of truly epic El Niño events. If this year sees the development of a major El Niño event, that could give researchers an important case study.
There’s growing interest in using model ensembles to attack the seasonal prediction problem. Much like crowdsourcing, the results from various models and various sets of model runs tend to outperform any individual model. “In part, this is because each model has its own specific deficiencies and strengths,” says researcher Gabriel Vecchi (NOAA Geophysical Fluid Dynamics Laboratory, or GFDL).
Vecchi is encouraged by results over the last couple of years from NMME (the North American Multi-Model Ensemble), a project that involves NCAR, NOAA, NASA, Environment Canada, and other partners. Vecchi also notes that individual models, such as GFDL-FLOR (see PDF), are improving in seasonal skill as they gain resolution and portray land-atmosphere interactions more fully.
There’s still much to learn about the dynamics of the Pacific Ocean, a region as vast as all of the world’s continents put together. “Ultimately, I think improvements in our understanding of the fundamental processes in the tropical Pacific are likely to yield better forecasts,” says Vecchi.
ENSO forecasts could also benefit from an even broader goal: “seamless” prediction systems that would offer guidance on timescales ranging from minutes to decades. The UK Met Office has taken strides in this direction with its Unified Model, and NCAR is focusing on this approach in its current strategic planning.
“With modeling systems that can handle a variety of spatial scales, we have a good chance to achieve greater skill in both predicting how an El Niño event will evolve and providing useful guidance to decisionmakers,” says NCAR director Jim Hurrell.
It’s easy to see why researchers in seasonal prediction are looking at models that can handle both large- and small-scale features. To figure out if a strong El Niño event is on the way, forecasters must analyze a series of complex events and processes, ranging from the shifting temperature and structure of subsurface waters across the Pacific to the evolution of trade winds as well as more localized bursts of wind. “It’s this complexity that makes El Niño both an intriguing phenomenon to try to understand and a vexing feature to try to predict,” Vecchi says.
One ingredient that appears to be crucial is a multiyear buildup of warm water in the western Pacific. “You can think of it as the ocean being ‘charged up’ for an eventual El Niño event,” says Vecchi. Over the past couple of years, warm waters have indeed been unusually deep here. (Some experts have cited this as a factor in Super-typhoon Haiyan’s extreme intensity.) Stronger-than-usual trade winds have pushed sea levels 4 to 8 inches above average over large parts of the western tropical Pacific.
Two types of slow-moving disturbances can also push water upward and downward across the Pacific. Rossby waves travel westward, while Kelvin waves move eastward. In both cases, the sea surface rises, then falls, by up to several inches over a period of weeks to months as the wave passes. Often these effects are transient, but sometimes they can help nudge the Pacific into or out of an El Niño pattern. So can the Madden-Julian Oscillation, a pulse of atmospheric energy generated in the Indian Ocean every few weeks. MJO events can push clusters of showers and thunderstorms eastward across the tropical Pacific.
These still don't tell the whole story. To get El Niño going, something must slow or reverse the trade winds. Once that happens, the displaced wind and water can then reinforce the El Niño state in a feedback process lasting for months. However, it’s not easy to turn around those persistent east-to-west winds.
Westerly wind bursts can help do the trick. The western Pacific has seen several such features in recent months. These clumps of west-to-east wind, pushing directly against the trade winds, can span hundreds of miles and can last a few days to several weeks. They can also kick off the Kelvin waves noted above.
One strong burst of westerly wind developed over the western tropical Pacific in January, and a second emerged in February. Both were bolstered by the flow funneling between pairs of low-pressure centers, or cyclones, straddling the Equator. (Because cyclones rotate in opposite directions on either side of the Equator, each pair of cyclones produced west winds toward the Equator.) A third burst appears to be taking shape this month. This one is a bit further east than its predecessors, a common trait during developing El Niño events. What’s more, some forecast models are predicting favorable conditions for even more westerly wind bursts over the next few weeks.
Ocean currents are moving from west to east (orange vectors) across an increasing swath of the tropical Pacific, as shown in this five-day average for March 10–14. In the OSCAR system (Ocean Surface Current Analysis Real-time), modeling is used to supplement the available data. Click to enlarge. (Image from NASA Jet Propulsion Laboratory and NESDIS/NOAA.)
There are already hints that the westerly wind is pushing warm water across the tropics, according to Paul Roundy (University at Albany, State University of New York). Roundy points to recent analyses that suggest west-to-east ocean currents have already progressed to the central Pacific, running counter to the usual trade-wind-driven flow (see graphic). While these model-guided syntheses of ocean data are not infallible, Roundy cautions, they do serve as another sign that the tropical Pacific may be edging closer to El Niño.
According to IRI’s Zebiak, “If the system is ready to switch over, then a punch at just the right time means it’ll happen then and not three months earlier or later."
Most of the world’s major seasonal prediction models now push the Pacific into an El Niño temperature regime by July. Researchers are closely watching the Pacific—including the interplay among the factors discussed above—and making their own assessments of how likely El Niño might be.
Klaus Wolter, a researcher at NOAA’s Earth Systems Research Laboratory, tracks El Niño using the Multivariate ENSO Index (MEI), which he formulated with colleagues. Wolter’s latest update (issued March 6) includes a graphic showing four analogous years: 1960, 1985, 2001, and 2005. Like this year, each of these had a six-month period classified as neutral up through February. In three of these four years, El Niño ended up forming. Wolter says he’s “even more bullish” than NOAA/CPC on the odds of an El Niño event later this year. An experimental forecast scheme based on the MEI shows a 67% chance of El Niño for the July–September period.
In Albany, Paul Roundy is also bullish. Based on the sequence of westerly wind bursts now under way, and the apparent similarity of the situation to what was going on in mid-1982 and early 1997 (just prior to the biggest El Niño events on record), he informally puts the odds at more than 80 percent that a significant El Niño event will develop in the next several months.
Caveat time: Depending on when and how models incorporate such features as MJOs, we can expect some variation in what they tell us over the next month or two, says Roundy. Missing buoy data (see sidebar) could also affect forecast skill. And even if an El Niño event on par with those in 1982–83 and 1997–98 were to develop, there would still be a bracket of uncertainty around the eventual impacts, given that we only have two prior events of that strength as analogs.
“We never have perfect predictability, whether there’s an El Niño or not,” says Zebiak. “The goal is to find ways to take advantage of the information we do have.”
Most of the time, trade winds blow from east to west across the tropical Pacific. This pushes warm water toward Indonesia as cooler water upwells off the coast of South America. Above the warm water, muggy air ascends in huge clusters of convection (showers and thunderstorms) over the western tropical Pacific. The air then moves back east at high altitudes, eventually descending over the sunny, cooler eastern tropical Pacific. (See diagram below.) Meteorologists have known about this loop, the Walker Circulation, for many decades.
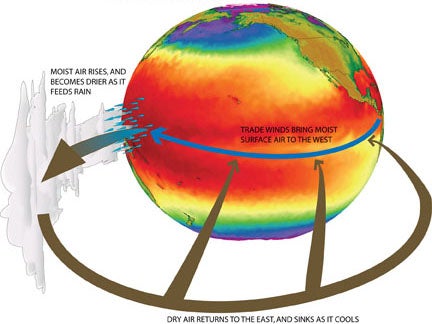
This diagram shows the Walker Circulation, a vast loop of air above the equatorial Pacific Ocean. (Illustration by Gabriel Vecchi, NOAA/GFDL.)
When trade winds are blowing more strongly than average from east to west, upwelling is favored and sea surface temperatures in the eastern tropical Pacific fall below average. This is La Niña—in some ways, an amped-up version of the air and ocean currents that prevail during “neutral” periods.
At other times, the trade winds weaken or even reverse, and upwelling is suppressed. This allows waters to warm over a vast swath of the eastern tropical Pacific, sometimes an area as large as the United States. The heating also helps generate showers and thunderstorms thousands of miles east of their usual favored location across the Maritime Continent. The rising air causes other circulations to readjust, sometimes thousands of miles away. This coupled atmosphere-ocean shift is what scientists are referring to when they talk about El Niño.
El Niño comes in various strengths, durations, and patterns, but often it develops in the northern spring or summer, peaks during the fall or winter, and weakens in the spring. Sometimes it rebounds for a second year.
To qualify as at least a minimal El Niño event, sea surface temperatures must remain at or above 0.5°C (about 1°F) for at least three months across the region dubbed Niño 3.4. (See historical records.) A “moderate” event would see readings holding at or above 1.0°C, and a “strong” event would be 1.5°C or higher. The strongest events on record, in 1982–83 and 1997–98, had three-month Niño 3.4 averages peaking at 2.2°C and 2.4°C, respectively, according to NOAA’s Oceanic Niño Index table.
Writer
Bob Henson