Brrr: The AO is way low
Jan 8, 2010 - by Staff
Temporary impacts to NSF NCAR Road, Parking Lot and Trails
View more information.Jan 8, 2010 - by Staff
Bob Henson | 8 January 2010 • No matter how you slice it, the last few weeks have been consistently wintry across large chunks of North America and Eurasia. To cite just one example: in NCAR’s hometown of Boulder, Colorado, the warmest temperature recorded during December was a mere 57°F (13.9°C). Only one other month in the last 20 years saw such a modest maximum, according to UCAR’s Matthew Kelsch. We’ll take a closer look next week at this winter’s cold intrusions—including the one now slicing across the U.S. Southeast—and examine just how unusual they really are.
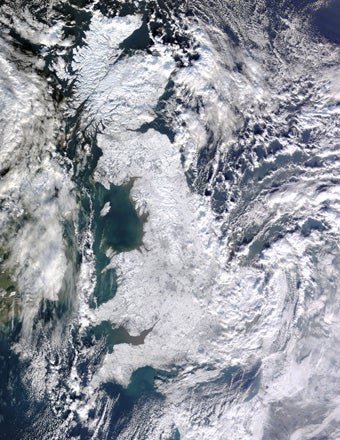 Great Britain is virtually encased in snow in this satellite image, taken on 7 January 2010 from the Moderate Resolution Imaging Spectroradiometer (MODIS) aboard NASA's Terra satellite. (Image courtesy Jeff Schmaltz, MODIS Rapid Response Team, NASA Goddard Space Flight Center.)
In the meantime, winter weather galore is unfolding throughout the Northern Hemisphere. Great Britain is now grinding its way through frequent snows and a prolonged freeze that’s tangled transportation and brought supplies of heating oil and road treatments to worrisome lows. Temperatures below 20°F (–6.7°C) could dive as far south as Spain this weekend, with more snow on tap for London.
Across eastern Asia, Seoul scored its heaviest snow of record (10.2 inches or 25.8 centimeters) on 4 January, while parts of the Beijing area saw roughly a foot of snow (33 cm), apparently the region’s heaviest dump since modern records began in China in 1951. Typically, the city gets dustings, so it reportedly only took 0.4 inch (1 cm) to break a one-day record there.
It’s been awhile since so much of the northern globe has been so wintry. What’s making the chill and snow so widespread? A root cause is always elusive when it comes to short-to-medium-range weather patterns, because they arise mostly from the atmosphere’s natural chaotic variability. However, there’s one prism through which this entire wacky winter comes into sharp focus.
Several acronyms, same idea
This concept is often referred to as the Arctic Oscillation (AO). That’s the phrase employed by NOAA and by New York Times writer Andrew Revkin in his timely Dot Earth blog post of 5 January. The National Snow and Ice Data Center has a short, nontechnical explanation of the AO.
Many researchers have come to favor another term for the same phenomenon, the Northern Annular Mode (NAM), so that’s what we’ll use here. At Colorado State University, Jillian L'Ecuyer and David Thompson maintain an Annular Modes Website that concisely describes the NAM and its southern counterpart, the SAM.
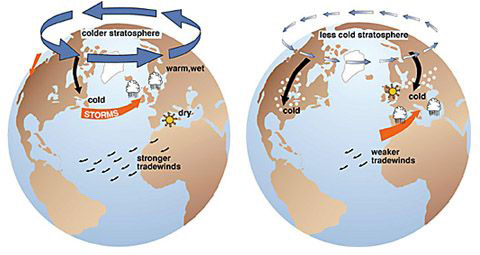 A schematic of the major features of the positive (left) and negative (right) modes of the Arctic Oscillation/Northern Annular Mode. (Illustration by John Michael Wallace, University of Washington, courtesy NSIDC Education Center.)
In a nutshell, the NAM characterizes how the mass of the Northern Hemisphere’s air is distributed from north to south. When the NAM is positive, there’s more mass (i.e., higher air pressure) in midlatitudes and less mass (lower pressure) further north, across the Arctic. This helps steer a strong west-to-east jet stream across the oceans and into the continents, typically bringing mild marine air in tow.
On the other hand, a negative NAM means that pressures are higher near the poles than in midlatitudes. This weakens the west-to-east jet stream and allows giant mounds of high pressure to spill southward from the frozen polar regions directly into continental areas, leaving much of the Arctic (especially near Greenland) less cold than usual.
As you might guess, the NAM is on the negative side these days, and that’s putting it mildly (or should that be coldly?). In December, the monthly average NAM value was –3.413, according to NOAA’s table of monthly values. This is by far the lowest average for any December in the NOAA table, which goes back to 1950.
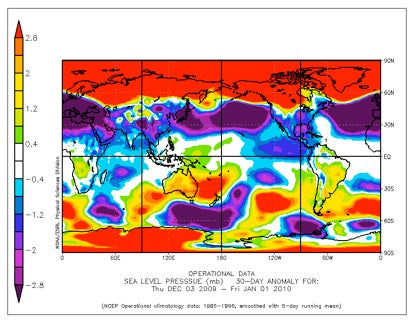 In this map, surface air pressure anomalies (departures from normal) averaged for December 2009 show unusually high pressure across the Arctic and unusually low pressure in northern midlatitudes. (Image courtesy NOAA/ESRL Physical Sciences Division.)
A NOAA map of surface pressure averaged for December (right) brings this value to vivid life. The intense reds across the Arctic correspond to unusually high pressure, while the strong purples at midlatitudes indicate anomalously low pressure, which is especially notable over the Atlantic, Pacific, and western Europe. Much of the region north of 30°N is off one end of the anomaly scale or the other.
“It’s remarkable,” says NCAR’s Clara Deser, who’s written extensively on the relationships between sea-surface temperatures, sea ice, and atmospheric pressure. “This is a pure NAM—as pure a pattern as I’ve seen—and the amplitude is obviously really big.”
December’s weather came straight out of the NAM cookbook. According to the Global Snow Lab of Rutgers University, more of North America was covered by snow than in any other December on record (going back to 1966). Conditions were quite wintry across Europe as well—as evidenced by the repeated cold-related closure of the Eurostar train between Britain and France—and China embarked on what may be its coldest winter in modern records.
What next?
If you’re longing for a warm-up, here’s an encouraging note: the NAM doesn’t typically stay in either positive or negative mode for very long, according to NCAR’s Jim Hurrell. He’s the lead editor of the 2003 book The North Atlantic Oscillation: Climatic Significance and Environmental Impact. (Roughly speaking, the North Atlantic Oscillation is the piece of the AO/NAM that plays out between the Atlantic and Arctic.) “This mode of variability is marked by very large excursions from one month to the next,” says Hurrell.
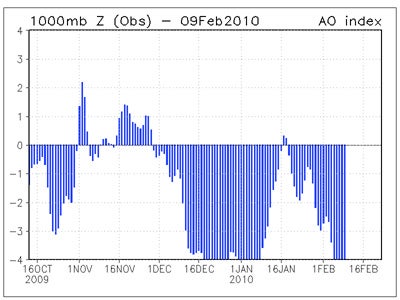 Daily AO values have fallen to extremely low levels since mid-December. (Image courtesy NOAA/NWS Climate Prediction Center.) 9 February 2010: This image has been updated to show the AO's recovery in late January and its return to extreme low values in early February.
However, December’s blockbuster NAM hasn’t yet swung to the mild side of the street. In fact, the values remain so strongly negative that they’re literally off the scale of NOAA’s daily graphic (left). Extended weather models predict that the values will rise later this month, in hand with a January thaw for much of the United States. Beyond that, it’s anybody’s guess.
“Most winters are not dominated by any particular regime,” note Hurrell and Deser in a recent overview of the NAO for the Journal of Marine Systems (PDF file). In other words, February could flip into a positive NAM mode just as easily as it could stay largely negative.
Although some winters end up favoring one mode or the other, predicting such trends is a perilous task. In September 2009 the UK Met Office, expecting a positive NAO to predominate, called for winter temperatures to be near to above average over much of Europe. NOAA’s winter outlook focused on the influence of the currently strong El Niño (PDF update), which usually brings warmer and drier than usual conditions to the Pacific Northwest and Midwest and cooler, wetter conditions across the Sunbelt. But thus far, the powerfully negative NAO seems to have overwhelmed the El Niño influence, especially in the U.S. heartland.
No matter what the index does, the vast and unusually extensive snow cover now in place across the Northern Hemisphere could help put the brakes on any rapid warming. Bundle up.
And what about climate change?
Although the AO/NAO/NAM rise and fall on many time scales, the wintertime values have slowly inched upward since the 1950s, as hinted at in the chart below. Global temperatures have also climbed during the same period. However, says Deser, “Just because the NAM has risen while global temperatures have risen does not mean that the latter causes the former."
In a 2009 Journal of Climate paper, Deser and NCAR’s Adam Phillips note that some model simulations of latter 20th century climate reproduce the weak upward trend in the NAO. However, it’s not statistically significant compared to natural variability. Other studies that focus on 21st-century climate project a continued rise in the average NAO.
According to the Hurrell and Deser paper, “One of the most urgent challenges is to advance our understanding of the interaction between greenhouse gas forcing and the NAO.” Yet even if the AO/NAO/NAM continues trending upward in the long run, shorter-term ups and downs will continue to unfold—just as they’re doing this winter.
 This graphic shows 3-month running mean values of the AO index. The departures are standardized using statistics for the period 1950–2000. (Image courtesy NOAA/NWS Climate Prediction Center.)