Whither our winters?
The last two were a study in contrasts
Mar 13, 2012 - by Staff
Temporary impacts to NSF NCAR Road, Parking Lot and Trails
View more information.Mar 13, 2012 - by Staff
Bob Henson | March 14, 2012 • This final week of winter will be exceptionally warm across most of the lower 48 states. That makes an interesting coda to a winter strangely devoid of snow and bitter cold. The usual scapegoats for weird U.S. winters are El Niño and La Niña. But there’s much more behind seasonal climate, as the last two winters demonstrate.
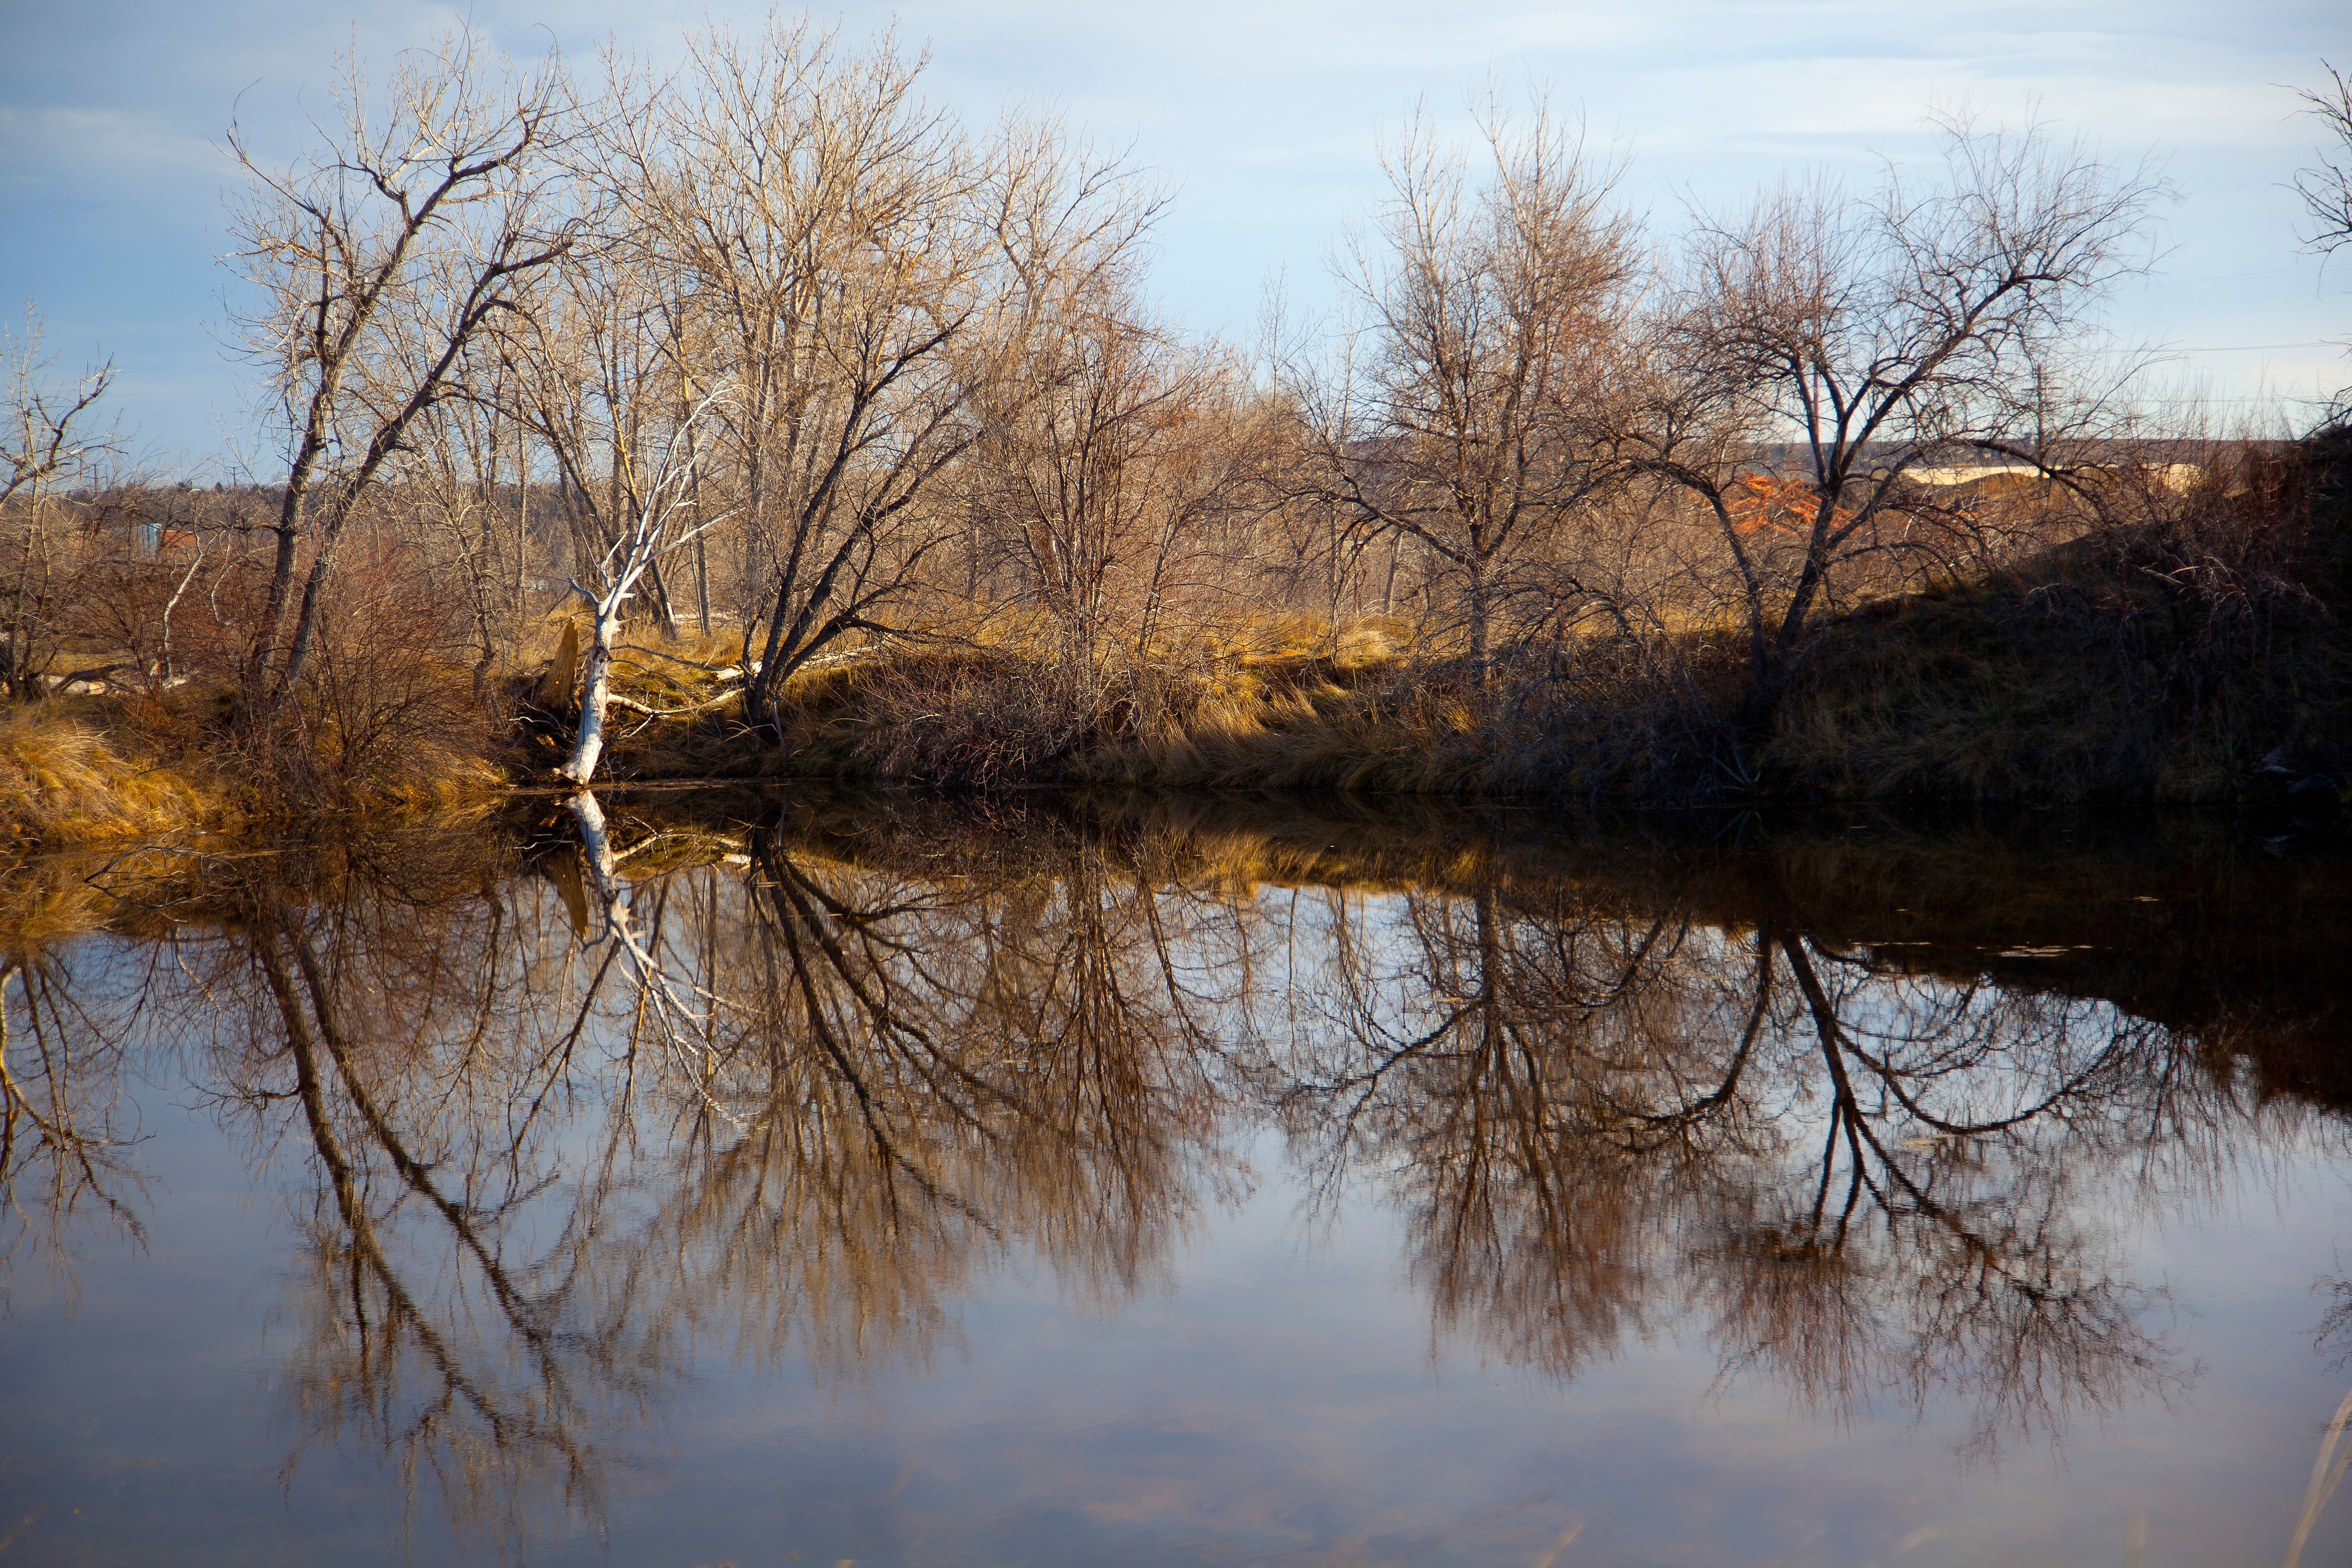
Was this past winter a mirror image of 2010–11? The maps below tell the tale. (©UCAR. Photo by Carlye Calvin. This image is freely available for media & nonprofit use.*)
The winter of 2011–12 was the second in a row to feature La Niña, the quasi-cyclic cooling of the eastern tropical Pacific. In general, La Niña tends to accentuate temperature contrasts across the United States (relatively cold toward the northwest, unusually warm toward the southeast) while it brings down global temperatures overall.
La Niña's counterpart, El Niño, brings warming to the eastern tropical Pacific and to the global atmosphere, but it tends to tamp down U.S. temperature contrasts (relatively mild toward the north, unusually cool toward the south).
Both of the last two winters departed from the La Niña script, but in starkly different ways (see maps, below). In 2010–11, the contiguous United States saw its 37th coldest winter in 116 years of recordkeeping. The biggest departures from normal were located east of the Rockies.
La Niña returned in 2011–12, albeit more weakly, but U.S. temperatures were almost a mirror image of the year before (see maps, again). This time the lower 48 states saw their fourth warmest winter on record. And the mildness was most concentrated in the Midwest and East—the same areas that froze in 2010–11.
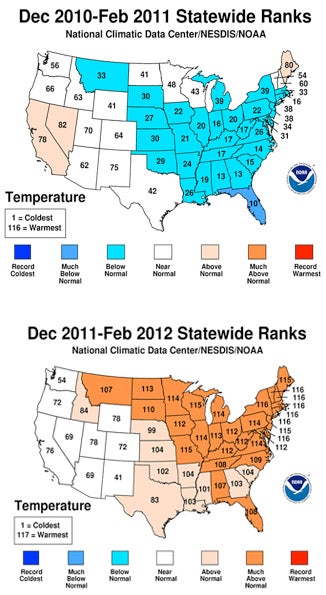
The mild U.S. winter of 2011–12 was a near-complete reversal of the cold conditions that prevailed in the previous winter, despite the fact that La Niña was in progress in both cases. (2010–11 and 2011–12 analyses courtesy NOAA National Climatic Data Center.)
These yin-and-yang winters threw seasonal forecasts for a loop. In both cases, NOAA’s winter outlook had drawn from the La Niña playbook, calling for unusual cold to the north and unusual warmth to the south.
Why the difference? For one thing, it’s a reminder that La Niña is inherently more fickle than El Niño, says renowned climate expert John “Mike” Wallace (University of Washington). Acocording to Wallace, there's less of a tendency during La Niña for fixed centers of high pressure to steer the flow.
“The variability over North America tends to be bigger during La Niña years than during El Niño years,” says Wallace. “I’ve always felt that with La Niña you can have almost anything, whereas with El Niño you’re tied down a bit more.”
Further insight can be gleaned by looking at the Arctic Oscillation, an index of the difference in pressure between the far north and the midlatitudes. When the AO is positive, cold air tends to stay trapped toward the poles. When the AO’s negative, the jet stream dips south more often, bringing outbreaks of Arctic air with it. I analyzed the effects of an extremely negative AO on winter 2009–10 here.
Unlike El Niño and La Niña, which are controlled by lumbering ocean currents, the AO can switch modes in a matter of days. Still, many winters are dominated by one AO mode or the other. In the winter of 2010–11, the AO was strongly negative from late November to late January, and frequent cold blasts swept into North America and Europe. This past winter, the AO stayed positive throughout the winter, except for three weeks in late January and early February (at which point brutal cold stunned much of Europe and Asia). Few Arctic outbreaks made it into the United States, which has given plants and people a running start toward spring.
Of course, the AO is really a descriptor rather than an explainer. Exactly why the AO behaved so differently across these two La Niña winters remains an open question.
One of the more intriguing attempts to predict wintertime AO behavior comes from Judah Cohen (AER). For the last few years, Cohen and colleagues have drawn on NSF and NOAA support to explore a hypothesis in which heavy October snow across Siberia produces atmospheric waves that ascend to the stratosphere and disturb the usual Arctic vortex, allowing the AO to trend negative in the following winter.
Cohen reports a surprisingly strong correlation between a quick advance of snow cover across Siberia in October and a negative AO in December through February. Cohen’s firm uses this and other tools to generate winter forecasts for clients, and the group has published the scientific underpinnings of their work in the open literature, including this paper (PDF) in Geophysical Research Letters. Science writer Andrew Revkin interviewed Cohen in this blog post and evaluated AER’s 2010–11 forecast here.
Siberian snow cover was near normal this autumn. Interestingly, though, AER’s three-month outlook for January to March 2012 (issued well after NOAA’s winter outlook, and not fully verifiable till the end of March) successfully pegged the warmth east of the Rockies, as shown on the forecast map within this NSF special report. Both AER and NOAA projected that the West Coast would be cooler than average.
Given that 2011’s disastrous tornado season has already been followed by an early rash of twisters in 2012, it’s only natural to ask what La Niña and the AO might have to do with that.
Answer: The plot thickens even further, as we’ll see in a follow-up post.
Update – March 15 | NCAR's Kevin Trenberth, who has studied La Niña events and processes for more than 20 years, weighs in: "Yes, there were La Niñas in play both winters, but outside of the Pacific there were huge differences in SSTs [sea surface temperatures] between the two." He notes that the El Niño of 2009–10 left behind record-high SSTs across parts of the Indian and Atlantic oceans. In turn, he adds, the atmospheric circulations forced by those warm waters helped stoke major flooding in Pakistan, Australia, and Columbia over the subsequent year. "In 2011, all of that largely vanished, and we were more back to West Pacific forcing," he says.