Twisters and teleconnections
What can oceanic patterns tell us about tornadoes?
Mar 20, 2012 - by Staff
Temporary impacts to NSF NCAR Road, Parking Lot and Trails
View more information.Mar 20, 2012 - by Staff
Bob Henson | March 20, 2012 • The roles played by La Niña and the Arctic Oscillation in the temperature dramas of the last two U.S. winters were the topic of my last post. Now let's talk tornadoes. It was unusually cold in 2010–11, but the spring of 2011 brought multiple rounds of fierce tornadoes, inflicting the most death and damage seen in many decades.
This winter it’s been unusually mild, and tornado season got off to an early start. The Mississippi, Ohio, and Tennessee valleys were pounded by twisters from February 29 to March 2 that killed more than 40 people. Such an early kickoff isn’t unprecedented—witness the Super Tuesday outbreak of February 2008—but it’s definitely worrisome.
One cause for concern is—you guessed it—La Niña. As summarized in this 2011 NOAA assessment, several studies have found a slightly enhanced risk of major U.S. tornado outbreaks in late winter and early spring when a La Niña is under way, especially between the Mississippi River and Appalachians. Such was the case for the catastrophic Super Outbreak that hit the Midwest and South on April 4, 1974, and for the comparable onslaught that ripped across the South on April 26–28, 2011 (here’s a PDF of the National Weather Service assessment of that outbreak).
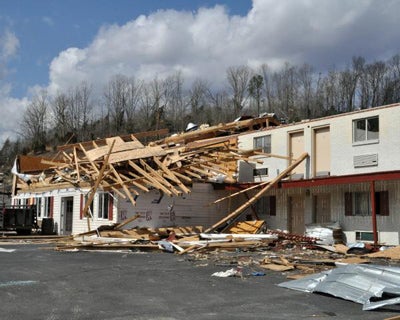
A tornado on March 2, 2012, severely damaged this motel at Salyersville, Kentucky. (Photo by Marilee Caliendo, FEMA Photo Library.)
Although La Niña did return for a second winter in 2011–12, it’s barely hanging on now. La Niña events typically weaken as the Northern Hemisphere moves toward summer. NOAA’s weekly update for March 13 (PDF) shows that ocean temperatures have actually warmed above normal across the far-eastern tropical Pacific Ocean. However, they’re still cool enough to qualify as La Niña in the region most often used to define the phenomenon (Niño 3.4, which straddles the equator from 120°W to 170°W longitude and 5°N to 5°S latitude).
Niño Region 3.4 (black rectangular box at center) straddles the tropical Pacific Ocean. (Image courtesy NOAA/NCEP/CPC.)
Why would a cooling of the Pacific help stoke tornadoes in the United States? In part it’s because La Niña tends to accentuate U.S. temperature contrasts, with strong frontal zones often stretching from southwest to northeast across the U.S. heartland. Other phenomena can interfere, though: plenty of La Niña springs have failed to produce an unusual amount of severe weather.
NCAR’s Ernesto Muñoz has dug deeper into the connections between severe U.S. thunderstorms and the sea. Muñoz’s work is now focused on ocean biogeochemistry, but the former SOARS protégé studied springtime storminess as a postdoctoral associate at the Cooperative Institute for Marine and Atmospheric Studies (University of Miami and NOAA). In a 2011 Climate Dynamics paper, Muñoz and adviser David Enfield shared their findings, which focus on the role of storm-fueling air masses that surge north from the Gulf of Mexico and Caribbean.
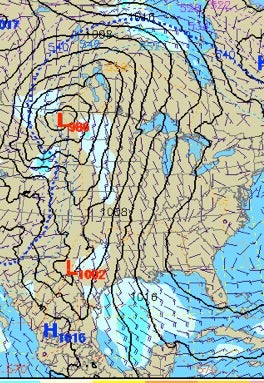
At 1200 UT (7:00 a.m. CDT) on the morning of March 19, 2012, this surface weather analysis shows winds streaming from the northern Caribbean and Gulf of Mexico across the central United States into Canada. The warm, moist flow has led to hundreds of record high temperatures and set the stage for severe weather and heavy rain. (Map courtesy NCAR's RAL Real-Time Weather Data.)
Unless you're an oceanographer or geographer, you may not know that the Gulf and Caribbean make up what’s called the Intra-Americas Sea. But if you’ve spent much time on the Gulf Coast, you’ve felt the muggy air and seen the moisture-filled clouds streaming north. That flow is courtesy of the Intra-Americas low-level jet (IA-LLJ). When conditions are right, strong winds in the lowest half-mile of the atmosphere race westward across the Caribbean, then curve north across the Gulf of Mexico into the central and eastern United States.
Forecasters traditionally watch for moisture-laden Gulf winds as a precursor to severe weather. But how far in advance can that flow be predicted? Muñoz addressed that question in one of the first studies to examine correlations between the springtime IA-LLJ and a wide array of ocean-atmosphere indices, including:
Each of these phenomena can affect weather far away, a process known as teleconnection.
The bottom line, Muñoz found, is that these indices suggest at least a hint of long-range predictive power for severe storms. The strongest single relationship is between a negative PNA in March and a heightened risk of tornadoes centered on that month across the southeast United States, roughly southeastward from Missouri and Illinois. That’s where early-season twisters tend to be focused, as opposed to the traditional Tornado Alley states from Texas to Minnesota, where severe weather season tends to arrive later in the spring.
The individual correlations that Muñoz found aren’t terribly strong. For the PNA example noted above, the correlation coefficient is about 0.46 (out of a maximum 1.0), quite modest by statistical standards. However, says Muñoz, what’s more important than any single teleconnection may be their collective effects on early-season severe weather.
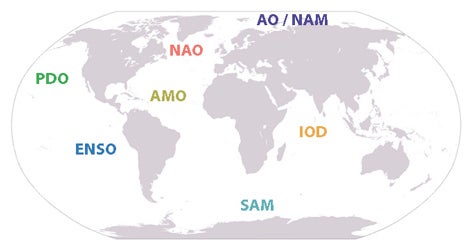
This interactive map provides descriptions and more details for several of the planet's most heavily researched regional modes and oscillations.
“It is the combined impacts of storminess from El Niño or La Niña, the PDO, the PNA, and in some cases the NAO that seems to be promising for long-range predictability,” he says. Muñoz points out that the idea of any resulting outlooks wouldn’t be to predict individual storms or tornadoes but to paint a rough picture of what might be expected in a given season, akin to the seasonal hurricane forecasts issued by Colorado State University, NOAA, and other groups.
Observational issues—especially the difficulty of observing and cataloguing all tornadoes in a consistent way—make this kind of work a challenge, Muñoz adds. “There’s still a lot of research needed. We need to learn what’s in between individual storms and the large-scale climate.”
Another scientist pondering the connections is Patrick Marsh, a doctoral candidate at the University of Oklahoma. Marsh serves as a liaison between NOAA’s National Severe Storms Laboratory and its Hazardous Weather Testbed, where new approaches to forecasting and warning techniques are scrutinized.
“This is a fascinating topic that I’ve been thinking about a lot,” says Marsh. “I think these larger-scale oscillations may show potential for seasonal forecasting of severe thunderstorm environments.” He’s more skeptical about their promise for seasonal tornado forecasts. For one thing, only a fraction of severe storms generate tornadoes, and it can be difficult even in the short term to know which ones will do the trick.
According to Marsh, NOAA forecasters don’t explicitly weave indices like the PNA into their longer-range storm outlooks, which now extend out to eight days. However, they do watch for large-scale shifts in circulation that can show up in computer models more than a week in advance, which are often associated with changes in patterns such as the PNA.