Putting this spring’s cold in context
How unusual is it—and what happened to warming?
May 9, 2013 - by Staff
Temporary impacts to NSF NCAR Road, Parking Lot and Trails
View more information.May 9, 2013 - by Staff
Bob Henson • May 10, 2013 | Bare trees and brown shrubs, freakish snows and harsh freezes: from Minnesota to Texas, it’s as if someone hit the “pause” button just ahead of springtime. The last month has seen a trail of smashed records across the central United States, as pulse after pulse of cold air careened down the Great Plains. Meanwhile, southern Canada has had record warmth. How does all this fit into the bigger picture of a warming climate?
There’s no ignoring how unusual things have been across the central states since mid-April. Among the excellent, detailed roundups are those by Chris Burt (Weather Underground) on the early May snows and Jason Samenow (Capital Weather Gang) on this week’s topsy-turvy North American temperatures. Here are a few of the tidbits I’ve found most compelling.
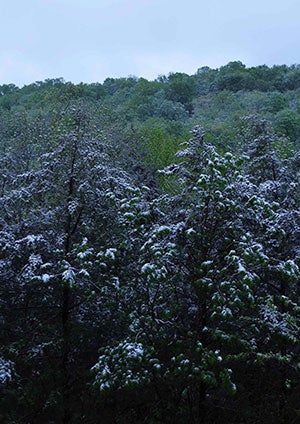
Forests near Eureka Springs were dusted by the first May snowfall in the recorded history of Arkansas. (Photo © Steve Chain.)
What led to this springtime string of cold and snow? It’s due in part to the perfectly normal seasonal shift of the polar jet stream.
The jet often flows from west to east across the heart of the United States in winter. By summer, it’s flowing mainly across Canada and the northern tier of states. Spring and autumn are times of transition, when the jet oscillates back and forth.
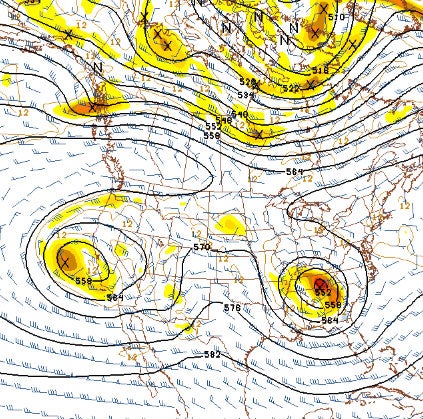
Cut-off centers of low pressure loitered near California and the U.S. South early this week, with the polar jet stream in a summerlike position across northern Canada. Shown here are upper-level winds as of 8:00 a.m. EDT on May 6. (Image courtesy NOAA/NCEP Model Analysis & Guidance.)
Throughout the year, packets of upper-level low pressure ride the jet stream, rippling along the flow like waves and often bringing stormy weather with them.
Sometimes these atmospheric waves “break.” Southward dips in the jet stream can become so large and deep that they snap off from the main flow. The result: an upper low marooned hundreds of miles south of the polar jet stream. Cut-off lows like these can linger for days before a “kicker”—the next wave—moves them along.
Throughout much of April, a steady polar jet stream flow funneled cold air from western Canada into the central states. Then a strong upper low within the flow got pinched off over the Great Plains at the end of April. The already-cool surface air beneath the upper low chilled further as rain and snow fell into it, which led to the tumbling records.
Several days later, another unusually strong upper low took shape off the west coast (see map above). These two systems meandered for days while the polar jet stream retreated far to the north, taking on a summerlike configuration. The result was an odd mix: cool readings across the U.S. South, with record warmth across southern Canada (see map below).
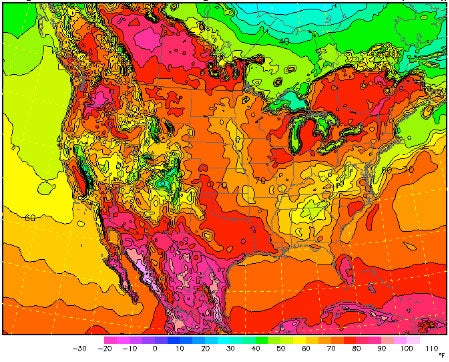
At 5 p.m. EDT on Monday, May 6, temperatures had soared into the 80s Fahrenheit across parts of Alberta and Saskatchewan (top left) while holding in the 50s across parts of Alabama, Georgia, and Tennessee (bottom right). (Image courtesy NCAR/RAL Real-Time Weather.)
Edmonton, Alberta—which is the continent’s northernmost city of more than a million people—was the warmest spot in Canada on May 6, hitting 88°F. Meanwhile, at the southeastern tip of Louisiana, temperatures in the town of Houma were in the 60s.
Breaking waves that lead to cut-off lows are a natural part of spring, says Lance Bosart (University at Albany, State University of New York). “Presumably, this is one way that nature reduces the north-to-south temperature gradient, by shedding high-latitude cold pools into midlatitudes with the return of the Sun,” says Bosart.
Still, he says, the jet stream’s huge leap northward and the record-setting mid-American cutoff low stand out. “It was quite a change in the structure of the Northern Hemisphere circulation over a ten-day period, one worthy of closer and more careful scientific scrutiny.”
This year’s protracted chill across the central states offers a stark contrast to the premature warmth observed last spring, especially in mid-March, when the Great Warm Wave of 2012 played out. That event brought a stunning array of record highs to much of the continent east of the Rockies.
Do the two events cancel each other out? One way to get a rough sense is to examine the tallies of daily record highs and lows across the contiguous United States for the year to date (January 1 through May 8) in 2012 and 2013.
Notably, 2013 is the first year since 1996 when daily record lows outnumbered record highs by the end of April. Still, it’s evident that last year’s U.S. warmth was far more anomalous than this year’s chill, at least so far. (Note that there are small variations in the array of U.S. reporting stations that are figured into the records calculations from year to year; these aren’t enough to change the big picture, though.)
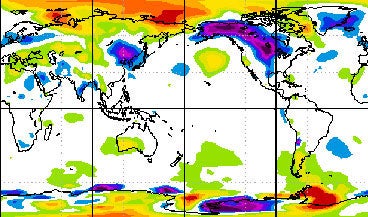
A belt from Alaska to the Dakotas saw the most widespread below-normal temperature departures of any place on Earth in April. (Image courtesy NOAA/ESRL/PSD Map Room. Click on the map to see its legend and more detail.)
Also worth noting: the planet as a whole isn’t running particularly cold this year. For January through March, global temperatures were the eighth warmest in more than a century of records.
Could this year actually end up on the cold side of the U.S. records ledger? It’s possible, even though long-term warming continues to make warm years increasingly likely. That’s the point NCAR’s Jerry Meehl makes in a 2009 paper he coauthored. Last year we turned those concepts into a lighthearted two-minute animation called "Steroids, Baseball, and Climate Change."
As for this year, "we’ll see how the warm season goes,” says Meehl. "The observations and models both show a lot of interannual variability with regards to the ratio of record highs to lows. So we’ll have years like 2012, when the ratio got well above 2 to 1, and other years when the ratio will be closer to 1 or even below 1.”
Over the long haul, Meehl still expects the ratio to climb each decade, barring a series of huge volcanoes or some other wild card.