-

Future summers could regularly be hotter than the hottest on record
In 50 years, summers across most of the globe could regularly be hotter than any summer experienced so far by people alive today. Reducing carbon emissions could cut the risk.
- Climate
-
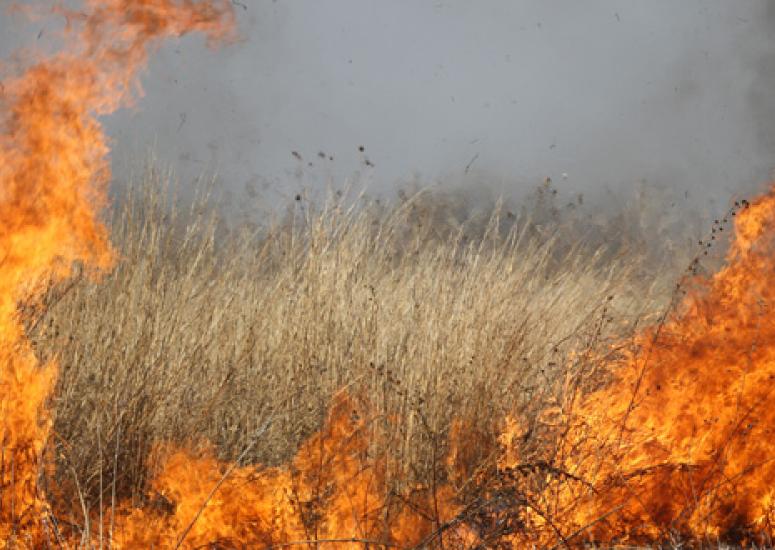
Population trumps climate and carbon in shaping the future of wildfires
The future pattern of population growth, not climate change, is likely to be the dominant factor in determining whether the amount of land burned by fires increases or decreases globally this century.
- Climate
-

A CO2 milestone in Earth's history
The ORCAS field project records carbon dioxide levels exceeding 400 ppm over one of the remote regions of the globe.
- Climate
-
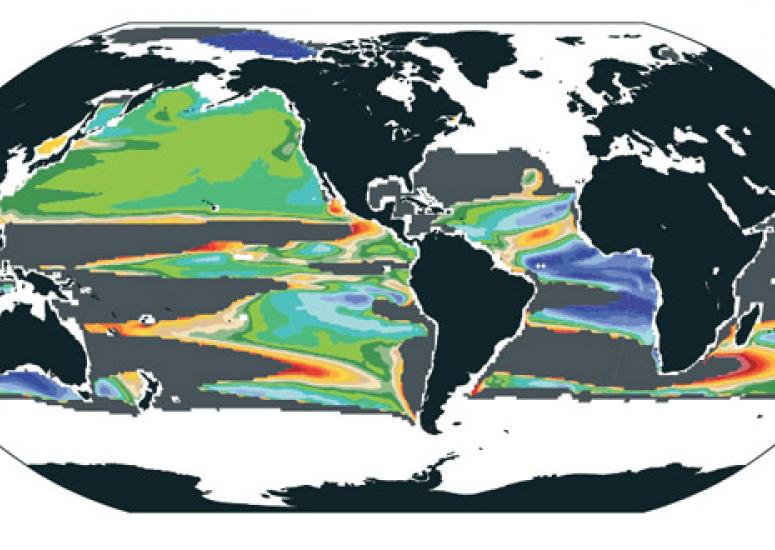
Widespread loss of ocean oxygen to become noticeable in 2030s
A reduction in the amount of oxygen dissolved in the oceans due to climate change should be evident across large parts of the ocean between 2030 and 2040.
- Climate
-
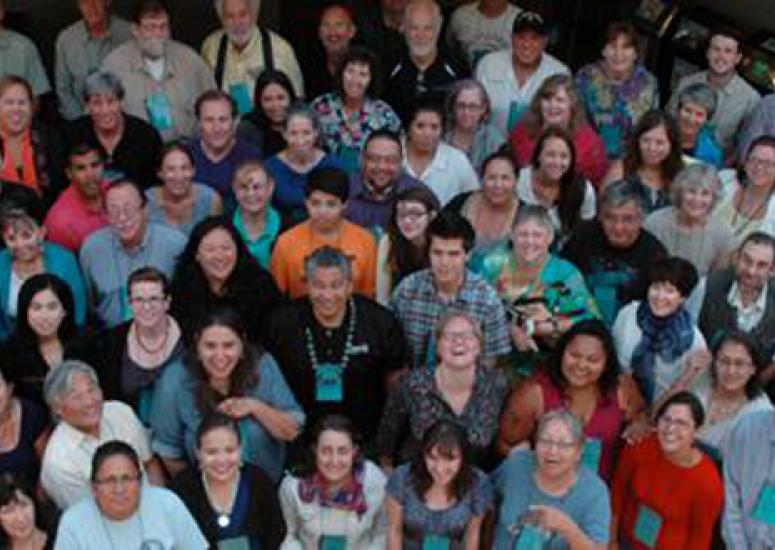
Rising Voices melds indigenous, western science perspectives
Hosted at NCAR, the program brings scientists and engineers together with Native American community members to build bonds and discuss ways to adapt to a changing climate.
- Climate